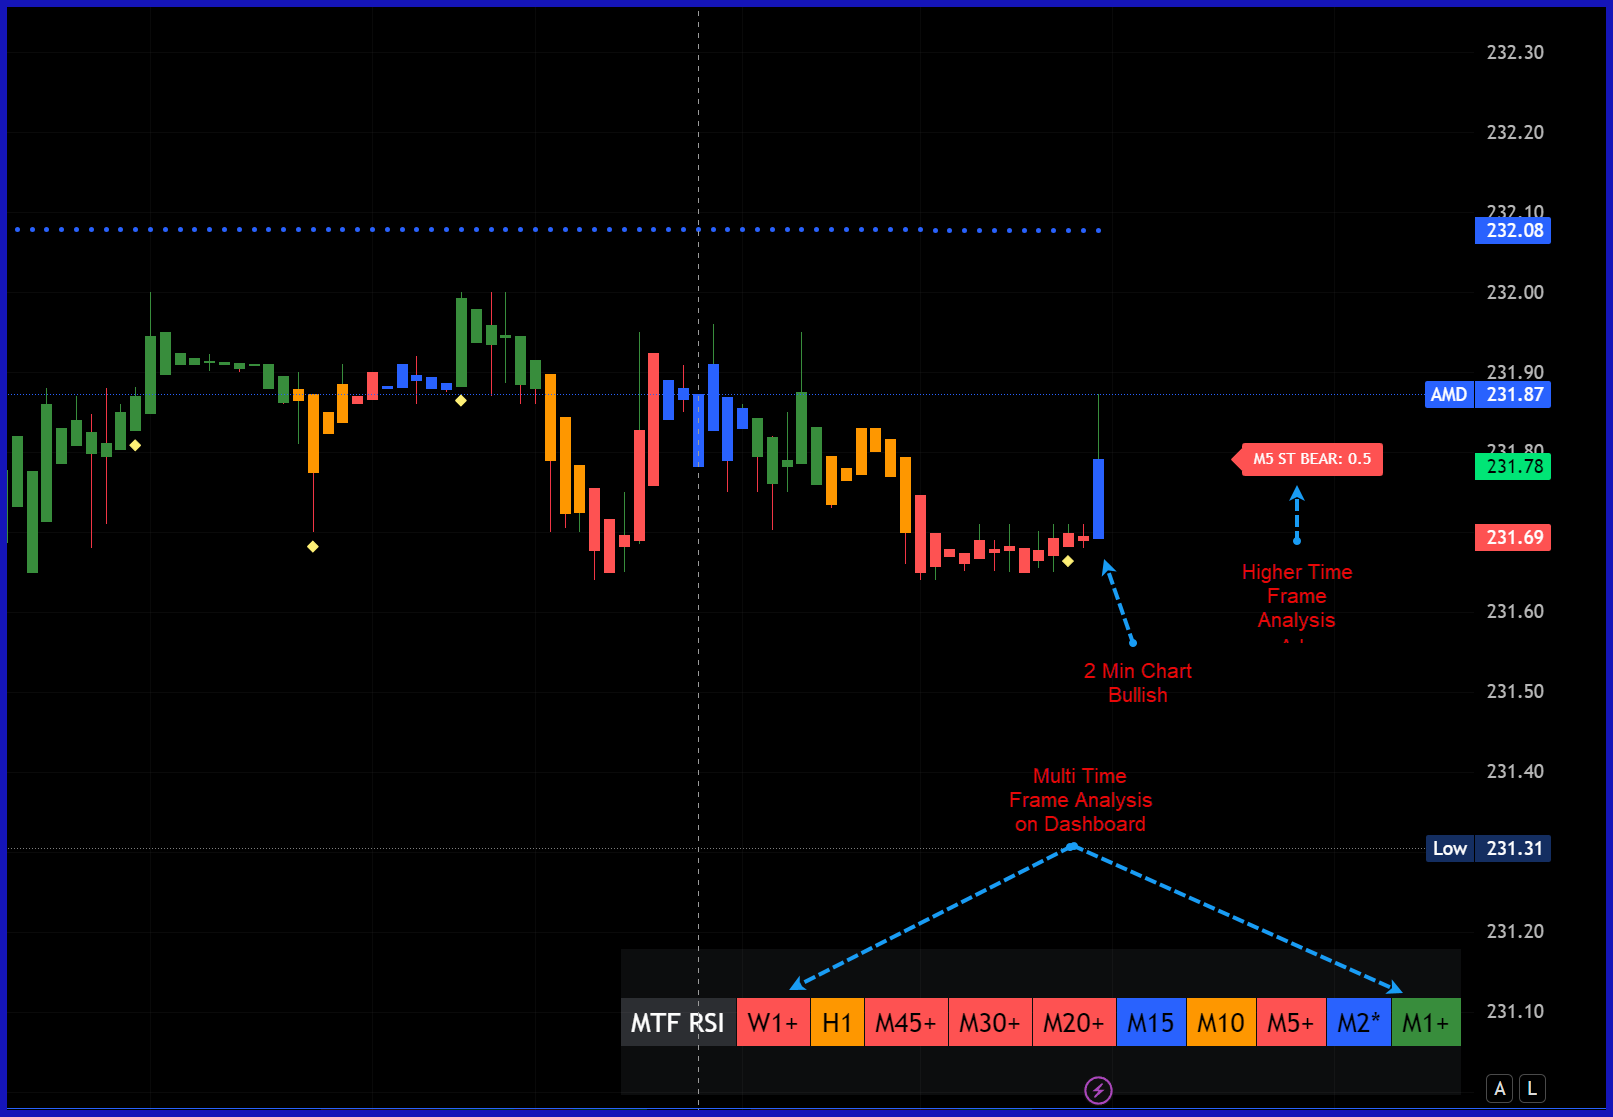
ST Pro RSI MTF Dashboard
Enhanced Laguerre RSI
A professional multi-timeframe momentum indicator that displays market conditions across 10 different timeframes simultaneously using an advanced Laguerre RSI calculation. Analyze price momentum with sophisticated filtering combined with RSI methodology for cleaner signals and comprehensive market sentiment analysis.
📊 Core Features
Monitor 10 customizable timeframes simultaneously, from 1-minute to monthly charts. See the complete market picture at a glance with color-coded status indicators showing bullish/bearish momentum across all timeframes. Current chart timeframe is automatically marked for quick reference.
Instant visual feedback with intelligent color-coded price bars. Red for strong bearish (≤20% RSI), Orange for bearish falling momentum, Blue for bullish rising momentum, and Green for strong bullish (≥80% RSI). Optionally color candles based on a higher timeframe for multi-timeframe alignment.
Dynamic smoothing that automatically adapts to market volatility using fractal energy calculations. When enabled, the gamma coefficient adjusts based on price range fractals for optimal signal quality. Toggle off to use fixed gamma for consistent smoothing across all market conditions.
⚙️ Advanced Controls
Get notified of important momentum shifts, overbought/oversold conditions, and trend changes. Six alert types including buy/sell signals at threshold crossovers, extreme level warnings, and bullish/bearish midpoint crossings. Never miss key trading opportunities.
Display next higher timeframe status directly on your chart for quick decision making. Shows momentum direction (BULL/BEAR/ST BULL/ST BEAR) with optional RSI value display. Fully customizable position with horizontal and vertical offset controls.
Optional 4-pole Gaussian pre-filter provides additional smoothing layer for cleaner signals in noisy markets. Adjustable length (1-100) and beta deviation (0.1-20) parameters let you fine-tune the smoothing intensity to match your trading style and market conditions.
Smoother signals with less lag than traditional RSI
Adjust colors, thresholds, timeframes, and display options
Dashboard refreshes with each candle close
🎯 Use Cases & Trading Strategies
📍 Trend Alignment
Ensure your trades align with higher timeframe momentum. Check the dashboard for consensus across multiple timeframes before entering positions. When 7+ timeframes show the same color, it indicates strong directional bias.
⏱️ Entry Timing
Identify optimal entry points by finding confluence between timeframes. Wait for lower timeframes (1M, 5M) to align with higher timeframe direction (1H, 4H, 1D) for high-probability setups.
🛡️ Risk Management
Avoid counter-trend trades by checking dashboard consensus. If higher timeframes show opposite colors from your trading timeframe, consider reducing position size or waiting for better alignment.
⚡ Scalping to Swing Trading
Works on any timeframe from 1-minute charts for scalpers to monthly charts for long-term investors. Customize the 10 dashboard timeframes to match your specific trading style and holding period.
🔬 Technical Innovation
Why Laguerre RSI?
Unlike traditional RSI which uses simple moving averages, the Laguerre RSI employs recursive filtering for several key advantages:
- Smoother Signals: Reduces noise without excessive lag
- Fewer False Signals: Better filtering of market noise and whipsaws
- Adaptive Response: When combined with Fractal Energy, automatically adjusts to volatility
- Heikin-Ashi Integration: Uses smoothed price data for even cleaner signals
Calculation Components
- Optional Gaussian Pre-filter: 4-pole Gaussian filter for initial smoothing
- Heikin-Ashi Transformation: Smooths price action before RSI calculation
- Fractal Energy (Gamma): Dynamic coefficient calculated from price range fractals
- Laguerre Filter: 4-stage recursive filter using the gamma coefficient
- RSI Calculation: Cumulative up/down movement ratio from filtered values
💡 Best Practices
Begin with default settings and adjust based on your asset and timeframe
Look for alignment across at least 3 timeframes before entering trades
BEAR+ and BULL+ conditions often lead to reversals or consolidation
Use support/resistance levels and chart patterns for confirmation
Test the indicator on historical data before live trading
Enable for volatile markets, disable for smoother, more consistent signals
ST Pro 5 MA Dashboard
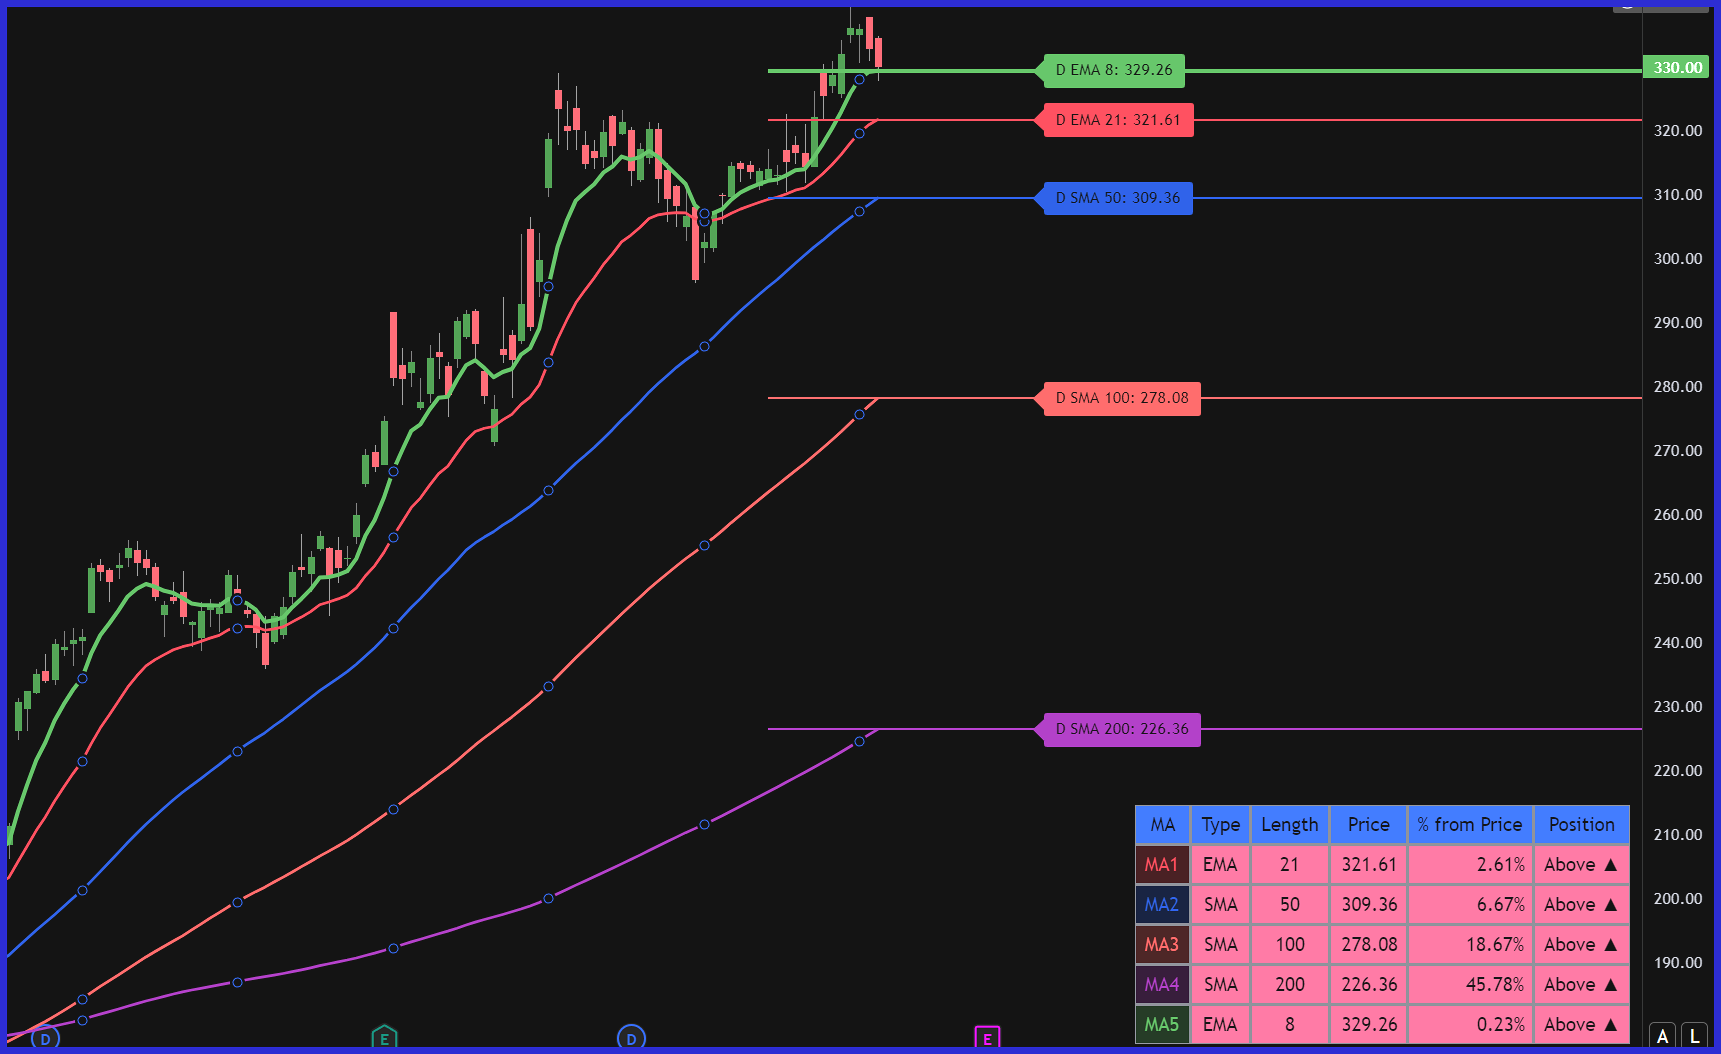
ST PRO 5 MA Dashboard
A professional moving average indicator with an intelligent dashboard that displays real-time analytics across all 5 MAs simultaneously. Track MA type, length, current price levels, percentage distance from price, and position indicators in one organized table. Perfect for traders who need quick, actionable information at a glance.
📊 Core Features
Real-time analytics showing MA type, length, current price, percentage distance from price, and position indicators (Above ▲ / Below ▼) all in one organized view. Color-coded MA labels match their corresponding lines for instant recognition.
Mix and match Standard Plots, Daily Level Lines, and Bubbles with independent checkboxes. Enable all three simultaneously or just what you need! Perfect for combining current timeframe MAs with daily levels for multi-timeframe analysis.
Choose from SMA (Simple), EMA (Exponential), WMA (Weighted), HMA (Hull), VWMA (Volume Weighted), or RMA (Running/Smoothed) for each of the 5 moving averages. Configure each MA independently with custom lengths, colors, and line styles.
⚙️ Advanced Controls
Perfect for day traders! See where daily moving averages sit during intraday sessions with horizontal lines and price bubbles. Combine with your current timeframe MAs to identify key support/resistance levels and multi-timeframe alignment.
Choose from 9 position options (Top/Middle/Bottom × Left/Center/Right), 4 size settings (Tiny to Large), and customize background, header, and text colors to match your chart theme. Show/hide toggle for when you don't need it.
Automatic alert conditions for price crossing above or below any of the 5 moving averages. Never miss important level breaks or trend changes. Quick setup through TradingView's alert system for all MA crossovers.
Instant Above ▲ / Below ▼ markers showing price position
Colors, thresholds, timeframes, and display options
Dashboard refreshes with each bar update
🎯 Use Cases & Trading Strategies
📍 Support/Resistance Levels
Identify key MA levels that price respects with horizontal lines and bubbles marking exact price points. The dashboard shows percentage distance from each MA, helping you spot stretched conditions and potential reversals.
⏱️ Entry Timing
Use the position indicators to time your entries. When price is Above ▲ multiple MAs with increasing percentages, it confirms bullish momentum. Look for alignment across all 5 MAs for high-conviction trades.
🛡️ Multi-Timeframe Analysis
Combine current timeframe MAs with Daily Levels mode for powerful multi-timeframe insights. See where daily MAs sit during intraday trading and use the dashboard to monitor both simultaneously.
⚡ All Trading Styles
Works for day traders using 1-5 minute charts with daily levels, swing traders tracking 20/50/200 MAs, and position traders monitoring long-term trends. Customize all 5 MAs to match your exact strategy.
🔬 Technical Specifications
Dashboard Features
The centerpiece dashboard provides instant market insight with comprehensive MA analytics:
- MA Type & Length: See your configuration at a glance (SMA 20, EMA 50, etc.)
- Current Price Level: Real-time MA values updated on every bar
- % from Price: Percentage distance calculations showing stretched conditions
- Position Indicator: Clear Above ▲ / Below ▼ markers for each MA
- Color-Coded Labels: Each row matches its MA color for instant recognition
Display Options
- Standard Plot: Traditional MA lines on your current timeframe chart
- Daily Lines: Horizontal lines showing daily MA levels for intraday traders
- Bubbles/Labels: Price labels with MA information displayed clearly
- Mix & Match: Enable any combination with independent checkboxes
- Line Customization: Width (1-5), style (solid/dashed/dotted), extension options
- Label Controls: Size, position, offsets, color, price display toggle
💡 Best Practices
Begin with 20/50/100/150/200 SMAs or 12/26/50/100/200 EMAs
Monitor % from price to identify overbought/oversold conditions
Use Daily Levels mode on intraday charts for powerful confluence
Look for price Above ▲ all MAs for strong bullish trends
Adjust dashboard colors and position to match your chart theme
Create alerts for MA crossovers on your key levels